Mastering Market Structure & Smart Money.
This isn't retail advice. This is a deep dive into the mechanics of price delivery. We cover Market Structure Shifts (MSS), Break of Structure (BOS), Volume, and Institutional Liquidity to help you read charts like a professional.
1. The Foundation
The 90/90/90 Rule
90% of retail traders lose 90% of their money in the first 90 days. Why? Because they trade patterns (Head & Shoulders) without understanding Context. Professionals wait for the market to show its hand via Structure before they enter.
Video: The Mindset Shift
Before you learn the technicals, you must unlearn the bad habits of retail trading. Watch this to understand the probability mindset required for success.
2. Risk-Free Practice
You wouldn't fly a plane without a simulator. Do not trade real money until you have proven your edge. A Demo Account is your training ground—it allows you to trade with virtual money using live market data.
The Objective
Use this phase to iron out mistakes without financial pain:
- Master the Platform: Learn to click the right buttons. You don't want to lose money because of a "fat finger" error.
- Validate Your Edge: Prove that your strategy actually works in real-time market conditions, not just in theory.
When to Go Live
The Golden Rule: Do not fund a real account until you have been consistently profitable on a Demo Account for at least 2–3 months. If you can't make money here, you won't make it with real cash.
🎁 SPECIAL OFFER
Sign up via our brokers below (Demo or Live) and deposit £500 to get ANY product on our website FREE (including Fusion PRO).
Recommended Brokers (Trusted & Tested)

3. The Time Machine: TradingView
You cannot be a professional without a professional workstation. TradingView is the interface used by 50 million traders. It is where you will mark up your charts, find your edge, and execute your plan.
Why You Need the "Essential" Plan
You can start for free. However, the free plan limits your speed. The secret weapon of the top 1% is Bar Replay (Backtesting).
The Power of Backtesting
"How do I get 5 years of experience in 6 months?"
Answer: Bar Replay. This feature allows you to rewind the chart to the past and replay the market candle-by-candle. You can trade historical data as if it were live.
Result: You can practice 100 trades in a single weekend. It accelerates your learning curve by 10x.
- Ad-Free Charting
- Unlimited Bar Replay
- Multiple Alerts (Never miss a trade)
*We recommend starting with the Free account. When you are ready to backtest seriously, the upgrade pays for itself in one good trade.
4. Market Structure (The Map)
Structure is the language of the market. Many traders get lost looking for "Patterns" like Flags or Wedges. However, patterns fail without context. Market Structure is your map; it tells you which direction the traffic is flowing so you don't drive into oncoming traffic.
A. Understanding Trend (HH / HL)
To read the map, you must identify the highs and lows.
Uptrend: Defined by a series of Higher Highs (HH) and Higher Lows (HL). The market is "climbing stairs."
The Golden Rule: Don't fight the current.
- In an Uptrend: We strictly ignore Sell signals.
- The Strategy: Wait for the price to pull back to a Higher Low, then look for a Buy entry.
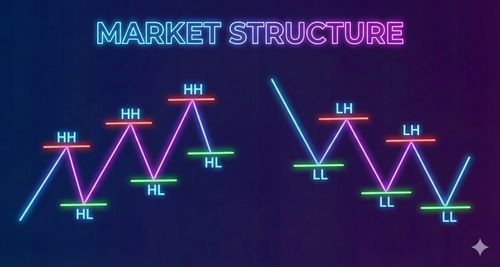
Figure 1: The textbook definition of Trend Structure. We buy at HLs and sell at LHs.
B. Identifying Swing Points
Filter out the noise. Not every tiny candle wick is a Swing Point. We are looking for significant turning points where institutional money has stepped in. A true Swing High is a "Fractal" formation: A high candle with two lower highs on the left and right. This confirms that price has temporarily peaked.
- The Strong Low (The Shield): A low that initiated a move strong enough to break a previous High. We expect this low to HOLD. This is your Stop Loss area.
- The Weak High (The Target): A high that pushed price down but failed to break a Low. We expect this high to be BROKEN. Because it is weak, price will likely magnetize through it to grab liquidity.
Trade Idea: In an uptrend, you buy at a Strong Low and set your Take Profit above the Weak High.
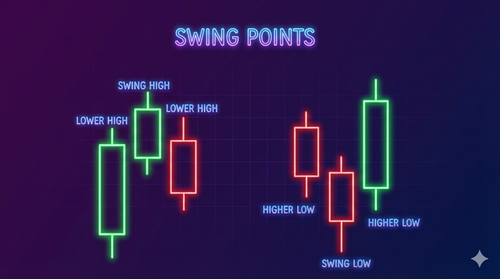
Figure 2: Identifying valid Swing Highs and Swing Lows.
C. Break of Structure (BOS)
Confirmation, not just motion. A BOS is the green light that the trend is healthy and continuing. It confirms that the buyers (in an uptrend) have enough power to conquer the previous price ceiling.
The Rule: Body Over Wick. Precision matters here. For a valid Break of Structure, the Body of the candle must close beyond the previous structural point.
⚠️ The Trap: The Liquidity Grab. If price breaks the high but closes back below it (leaving only a long wick), it is NOT a BOS. It is a Liquidity Grab (Stop Hunt). This is often a trap to lure in breakout traders before reversing the price. Pro Tip: Patience pays. Never assume a break is happening while the candle is still moving. Wait for the candle close.
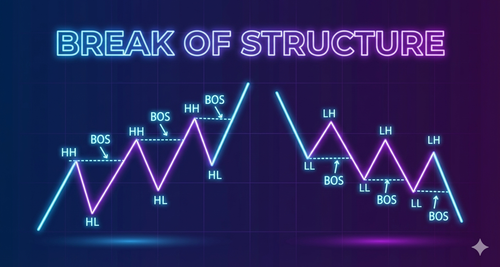
Figure 3: BOS confirms trend continuation.
D. Market Structure Shift (MSS)
The tide is turning. Also known as a "Change of Character" (ChoCh), this is your earliest warning signal that a trend is dying and a new one is beginning.
How to Spot It: In an Uptrend, the market is protected by Higher Lows (Strong Lows).
- The Event: Price crashes down and breaks the most recent Higher Low (HL).
- The Signal: The buyers who were protecting that low have failed. Control has shifted from Buyers to Sellers.
The Implication: Once an MSS occurs, the "Buy the Dip" strategy is invalid. Shift Bias: Stop looking for Buys. New Plan: Wait for a rally to set a Lower High, and look for Sell setups.
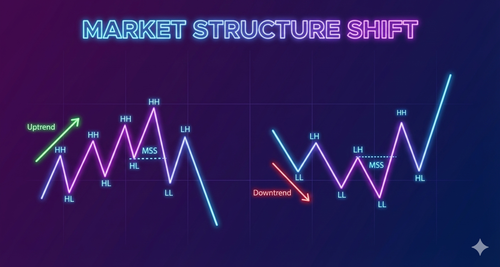
Figure 4: MSS signals a potential reversal in trend.
5. Support & Resistance
Price has memory. The market tends to reject areas it has rejected before. As shown in the image, think of the market as moving between a "Floor" and a "Ceiling."
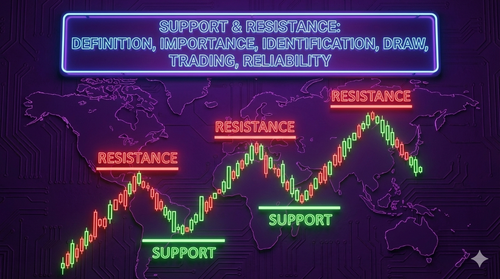
Figure 5: Notice how price reacts to the *Zone*, not just a single line.
1. Decoding the Image
- Support (The Green Levels): This is the "Floor." It is a price level where buying pressure is strong enough to overcome selling pressure. When price drops to this green zone, it tends to bounce back up.
- Resistance (The Red Levels): This is the "Ceiling." It is a price level where selling pressure is strong enough to stop the price from rising. When price rallies to this red zone, it tends to reverse down.
2. The Golden Rule: Draw Zones, Not Lines
While the image uses clean lines for clarity, the live market is messy. Institutional orders are stacked in blocks, not on a single pip.
Don't: Draw a thin line at exactly 1.0500.
Do: Draw a rectangular "Zone" that covers the wicks and bodies where price reacted. This keeps you safe from fake-outs.
3. Role Reversal (The Flip)
Support and Resistance are not permanent.
- When Support Breaks: The "floor" gives way and often becomes the new "ceiling" (Resistance).
- When Resistance Breaks: The "ceiling" is shattered and often becomes the new "floor" (Support).
Trade Idea: Don't chase the price in the middle of the chart. Wait for the price to hit a Green Zone (Support) to look for buys, or a Red Zone (Resistance) to look for sells.
6. Volume Relationships
Volume verifies price. Think of Price as the car and Volume as the gas tank. A car can coast uphill for a moment without gas, but it won't last long. "Smart Money" (banks and institutions) can hide their intentions, but they cannot hide their volume.
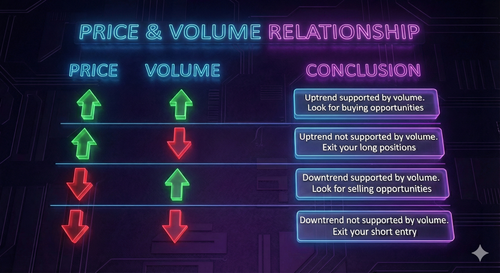
Figure 6: Understanding the relationship between price spread and volume.
Decoding the Cheat Sheet
- Strength (Supported Move): Price Moves + Volume Rises: Whether price is going UP or DOWN, if volume is increasing, the move is real. The trend is healthy.
- Weakness (Unsupported Move): Price Moves + Volume Drops: If price makes a new High but volume is lower than the previous high, the trend is "running out of gas." Be ready for a reversal.
The Breakout Test
Use volume to filter out fake-outs:
1. Validation (The Real Deal)
The Setup: Price breaks a key Support/Resistance level with a large candle.
The Volume: Volume is HIGH (significantly above average).
Verdict: Institutions are participating. It is safe to look for an entry.
2. Anomaly (The Trap)
The Setup: Price breaks a level with a large candle, looking like a breakout.
The Volume: Volume is LOW or declining.
Verdict: This is a trap. There is no professional backing behind the move. The market will likely snap back like a rubber band.
7. Institutional Price Delivery (SMC)
The Market is an efficient machine. This section covers the institutional footprints: Fair Value Gaps (FVG) and Order Blocks (OB).
Fair Value Gaps (FVG)
When institutions enter the market with massive volume, they move price so fast that it creates an "Imbalance." A Fair Value Gap (FVG) is the footprint of this aggression. It is a specific area on the chart where price has moved too quickly, leaving unfilled orders behind.
The Anatomy of an FVG (The 3-Candle Rule)
As shown in the image below, an FVG is always identified using a 3-candle sequence.
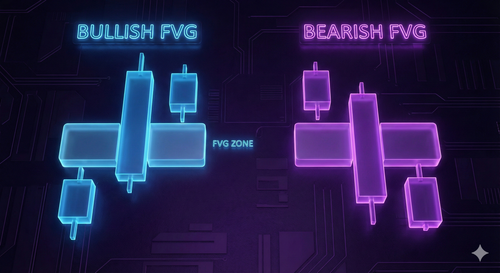
Figure 7: Price aggressively leaves (Blue Zone), then returns to tap it.
- Bullish FVG (The Blue Zone): How it forms: Aggressive buying power. The Gap: Look at the space between the High of Candle 1 and the Low of Candle 3. The Logic: The large middle candle represents pure buying. There were no sellers to match the orders, creating a "vacuum" of price. The Trade: We expect price to dip back down into this Blue Zone to pick up the remaining buy orders before continuing up.
- Bearish FVG (The Purple Zone): How it forms: Aggressive selling pressure. The Gap: Look at the space between the Low of Candle 1 and the High of Candle 3. The Logic: The price crashed so hard that buyers didn't have a chance to participate. The Trade: We expect price to rally back up into this Purple Zone to "rebalance" the price before dropping further.
Why Price Returns (The Magnet): Think of the FVG as a magnet. The market algorithm seeks "Fair Value." Don't Chase: When you see that massive middle candle, do not jump in. You are buying at a premium. Be Patient: Wait for the price to retrace and tap into the FVG Zone. That is your high-probability entry point.
Order Blocks (OB)
The footprints of the banks. While Fair Value Gaps are about speed, Order Blocks are about positioning. An Order Block is the specific candle where institutions stacked their orders before driving the price aggressively.
Identifying the Block
We are looking for the point of origin for a massive move.
- Bullish Order Block (The Launchpad): The Pattern: The last Down (Red) Candle before a violent move UP. The Logic: Banks sold briefly to gather liquidity (stop hunts) before buying heavily. They are now "trapped" in those short positions. The Trade: When price returns to this Red candle, banks will buy again to mitigate their losses and defend the trend. Buy at the top of the Red candle.
- Bearish Order Block (The Ceiling): The Pattern: The last Up (Green) Candle before a violent move DOWN. The Logic: Banks bought briefly to lure in retail traders before dumping the price. The Trade: When price rallies back to this Green candle, banks will defend their short positions. Sell at the bottom of the Green candle.
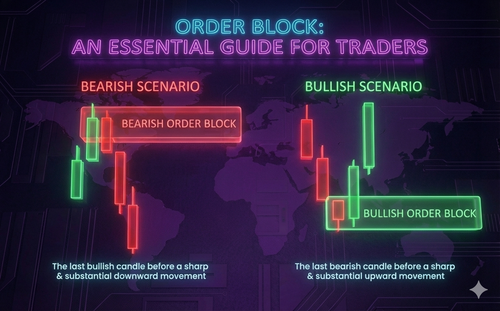
Figure 8: Order Blocks act as institutional support/resistance.
The "50% Mean Threshold": Pro Tip: Order Blocks can be large. To reduce your risk, measure the body of the Order Block candle. Aggressive Entry: Enter at the Open of the block. Precision Entry: Enter at the 50% mark (the middle) of the block body.
💡 The "Fusion" Solution
Spotting BOS, MSS, FVG, and Order Blocks manually is difficult. Fusion PRO runs this complex analysis in the background. It combines Structure, Momentum, and Institutional Levels to give you simple Sniper Entries when the conditions align.
Start 7-Day Free Trial8. Risk Management Visualizer (The Math of Survival)
Risk comes first. Profit comes second. You can have a 90% win rate strategy, but if you risk too much per trade, a single losing streak will wipe you out. This interactive calculator allows you to simulate different scenarios to see the "Math of Ruin" in action.
Interactive R:R Lab
Live Calc200
Consecutive losses to blow accountOur Recommendation
- Risk per Trade: 0.5% (Half of one percent). Why? You can lose 20 trades in a row and only be down 10%. This ensures you stay in the game long enough to learn.
- Risk-to-Reward (RR): 1:2 (Minimum). Why? For every $1 you risk, you must aim to make $2. This mathematically tilts the odds in your favor, allowing you to be profitable even if you lose more trades than you win.
The Bottom Line: Protect your capital at all costs. Start small, grow slowly, and let the mathematics of compounding work for you.
9. Psychology & Discipline
The chart doesn't defeat traders; their own emotions do. You can have the best strategy in the world, but if you cannot control your mind, you will lose. Trading is 10% Strategy and 90% Psychology.
The 3 Horsemen of Account Blowing
1. FOMO (Fear Of Missing Out)
The Trap: You see a massive green candle and think, "It's taking off without me!" You jump in at the top, just before the price reverses.
The Fix: Use Limit Orders. Never chase price at the market. If the bus leaves the station, wait for the next one.
2. Revenge Trading
The Trap: You take a loss and feel angry or "robbed." You immediately open a larger trade to "make it back" quickly. This usually leads to a bigger loss.
The Fix: The "Walk Away" Rule. After a loss, you must physically leave your desk for at least 1 hour. Reset your brain before you touch the mouse again.
3. Overtrading
The Trap: You are bored. The market is slow, but you want to feel productive, so you force a trade on a mediocre setup.
The Fix: "Cash is a Position." Professional traders are paid to wait, not to click buttons. If there is no A+ setup, doing nothing is the most profitable decision you can make.
Mindset Shift: Amateurs want to be right. Professionals want to be profitable.
10. Trading the News
⚠️ DANGER: Do not trade 15 mins before/after Red Folder events (NFP, CPI, FOMC). Slippage will destroy your stops.
The fastest way to lose a funded account. News events inject massive volatility into the market instantly. While this looks like an opportunity to make quick money, for 99% of traders, it is a graveyard.
The Mechanics of a Crash
Why is it so dangerous?
- Slippage: This is when the market moves so fast it "skips" price levels.
- The Nightmare Scenario: You set a Stop Loss of 10 pips. The news hits, price gaps over your stop, and your broker fills you at a 50 pip loss. You cannot dispute this; the price simply didn't exist at your stop level.
- Spread Widening: During news, liquidity dries up. The spread (cost to trade) can explode from 1 pip to 20 pips instantly, triggering your stop loss before the move even happens.
The Protocol: The 15-Minute Rule. Strict Rule: Be flat (no open positions) 15 minutes before and 15 minutes after a Red Folder event. Let the dust settle before you look for an entry.
The Big Three to Watch
- NFP (Non-Farm Payrolls): First Friday of the month. US Employment data. Massive impact on USD & Gold.
- CPI (Inflation): Measures inflation. Dictates what the Federal Reserve will do with interest rates.
- FOMC Meetings: Interest rate decisions. These set the trend for the next month.
11. The Pre-Flight Checklist
Discipline beats talent. Pilots do not "guess" if the plane is ready; they follow a strict protocol. You are the pilot of your capital. Before you ever click Buy or Sell, you must check every box.
The "All or Nothing" Rule: If one box is unchecked, it is a NO TRADE.
- 1. Trend Check (The Wind): Am I trading with the Higher Timeframe (HTF) trend? Zoom out. Swim with the current.
- 2. Structure (The Signal): Is there clear evidence of a setup? Confirm you have a valid Break of Structure (BOS) or Market Structure Shift (MSS). Don't anticipate it; wait for it to print.
- 3. Area of Interest (The Location): Where am I entering? Ensure price is tapping into a Key Level, Fair Value Gap (FVG), or Order Block. Never trade in the "middle of nowhere."
- 4. Risk (The Shield): Is my position size correct? Use the calculator. Ensure your Stop Loss risk is strictly capped at 0.5% (or your personal limit).
- 5. News (The Weather): Is the sky clear? Check the Economic Calendar. If there is a Red Folder event in the next 30 minutes, step away from the desk.
"Final Note: A checklist prevents you from making emotional decisions in the heat of the moment. Print this out and tape it to your monitor."
🎓 The Final Exam
You have completed the modules. Pass this test to unlock your next steps.